Use cases

What moving ground tells you.
Five stories from the data.

Each of these starts with the same measurement — how far every pixel of ground has moved, pass after pass, with ten years of history — and ends with a decision nobody could have made from a few points on roofs. The maps are real APSIS™ results from open Sentinel-1 radar.

01 Water networks

Find the leak before the road sinks.

With Origin Tech · water networks

A leaking main does not announce itself. Water escapes into the ground, softens and washes out the soil around the pipe, and the surface above begins to move — long before a wet patch appears or the road gives way. Treated water is lost for months, and the eventual repair is an emergency.

Working with Origin Tech, Terra Motion's ground-motion data is joined to the water network itself. Every stretch of main carries the movement of the ground above it, re-measured with every satellite pass, so the lengths that are moving rise to the top of the inspection list and crews dig in the right street. Rural trunk mains, which no sensor network reaches, are covered exactly like the town centre.

  • The whole network on every pass — not a sample of sensor sites
  • Nothing installed in the ground
  • Ten years of history to tell a new leak from ground that has always moved
  • Delivered as data for the network model, not as a report
What the data showed

[Pilot detail — network length covered, stretches flagged, leaks confirmed — to be agreed with Origin Tech before publication.]
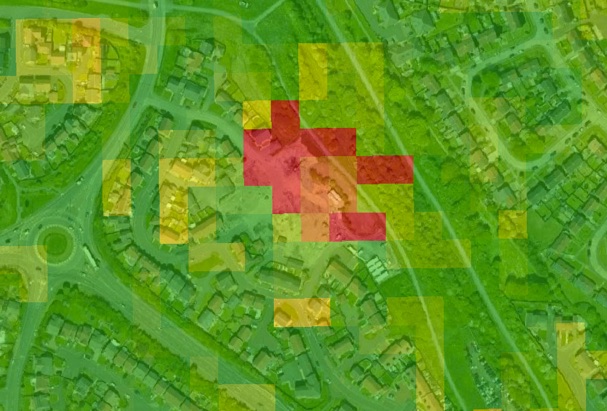
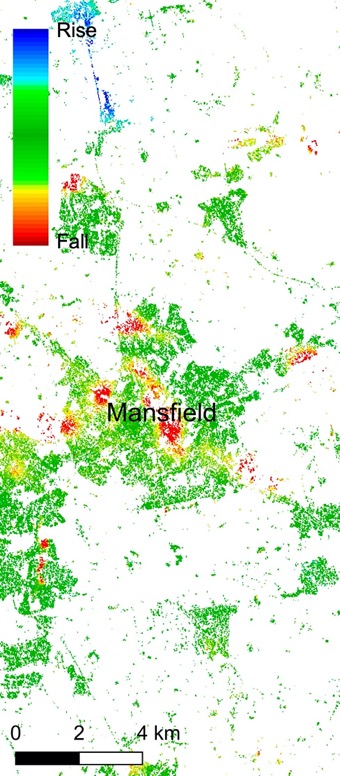
Figure to followThe pilot network with ground motion drawn along the mains — supplied from the Origin Tech work.
Drop the image in as assets/cases/water-network.jpg and replace this placeholder.

02 Nature and peatland

Show that restoration is working — across a whole landscape.

With NatureScot · Scottish peatlands

Healthy peat breathes: it swells when wet and settles when dry, season after season. Drained and damaged peat behaves differently — it dries out, releases carbon and, on slopes, can slide. Restoration is meant to bring the breathing back, but proving it across thousands of hectares of remote bog has meant field surveys that cover a fraction of the ground.

Peat is exactly the terrain conventional satellite methods cannot measure: nothing on it returns a stable radar echo, so the maps come back empty. APSIS™ measures every pixel of the bog. With NatureScot, the seasonal motion of restored and unrestored peat can be followed across whole landscapes, year on year, without a single site visit — evidence for restoration funders and for carbon and nature markets.

  • Every pixel of peat measured, where conventional InSAR returns nothing
  • Seasonal swell and settle visible per pixel, year on year
  • Peat-slide risk: ground that is moving before it fails
  • Landscape scale, no equipment on the bog
What the data showed

[Programme detail — sites, hectares monitored, seasons covered and what the motion showed — to be agreed with NatureScot before publication.]

Figure to followSeasonal motion over a restored peatland, restored and unrestored ground side by side — from the NatureScot programme.
Drop the image in as assets/cases/peatland.jpg and replace this placeholder.

03 Insurance and property

Know which postcodes are moving.

Insurers and reinsurers · Newcastle upon Tyne · Mansfield, Nottinghamshire

Insurers already price flood with a map, and buy maps of unstable soils and old workings to set premiums by postcode. Ground-motion data is that map with the movement in it: every pixel of the country, ten years of history, refreshed with every pass — and it covers the rural land where void maps and Europe's EGMS service go thin.

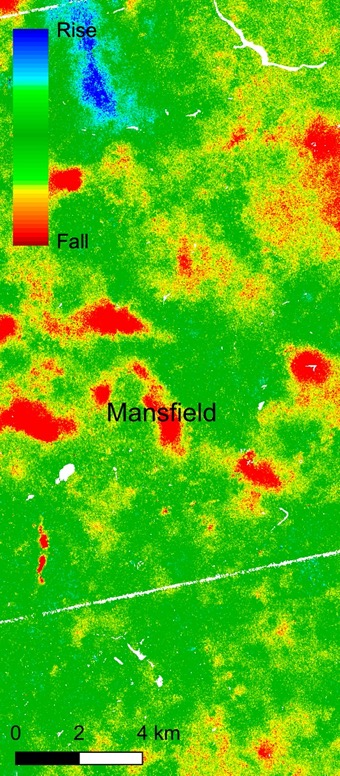
In Newcastle upon Tyne, the APSIS™ raster over a housing estate shows a patch of ground sinking. The homes on it, at West Allotment, were later demolished after they were found to have subsidence (Chronicle Live). Around Mansfield, in the Nottinghamshire coalfield, conventional InSAR returns points only where buildings give a stable echo; APSIS™ returns the whole field, and the subsidence and heave over legacy coal workings run straight through the open ground between the towns. Regional mosaics have picked out mine-water effects across Merseyside and the collapse of a former landfill and opencast site in East Lothian the same way.

  • Perils: landslides, mining, soil shrink and swell, engineering works, erosion, wet and dry cycles
  • Premium adjustment by postcode, portfolio exposure, claims triage, reinsurance
  • Rural land included, not only the towns
  • National and regional mosaics pick out hazard hotspots — Terra Motion published a deformation map of the UK in 2018
What the data showed

Newcastle: the sinking patch sits under the estate that was later demolished for subsidence. Mansfield: subsidence and heave over legacy workings, visible between the towns where conventional InSAR is blank.

APSIS™ · Newcastle upon TyneAPSIS velocity over housing in Newcastle upon Tyne: a red patch of sinking ground over the estate, green stable ground around it
Conventional InSARConventional InSAR over Mansfield: scattered points on the towns, blank countryside
APSIS™APSIS over Mansfield: every pixel measured, with red subsidence and blue heave over the coal workings between the towns
Top: APSIS™ velocity over housing in Newcastle upon Tyne — red is sinking; the estate was later demolished for subsidence (Chronicle Live). Below: the same Sentinel-1 archive over Mansfield — conventional InSAR (left) and APSIS™ (right); red falling, green stable, blue rising.

04 Infrastructure and construction

See what the works next door are doing.

Contractors, asset owners and regulators · Kennington, London · Willand, Devon

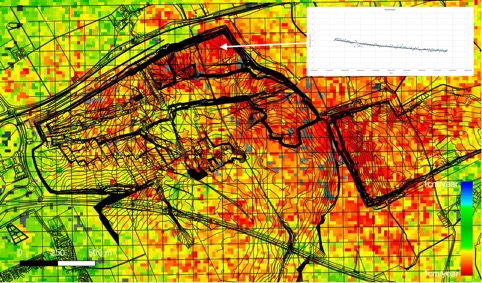
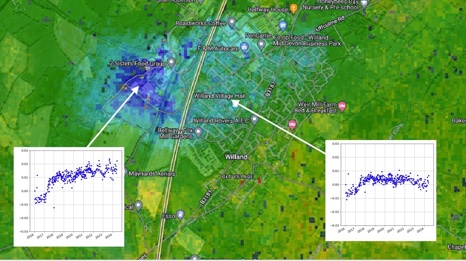
Measure a building on its own and you learn that it is moving. Measure everything around it and you can see what is doing it. In Kennington, south London, dewatering for a metro extension pulled down the streets around the works: the subsidence follows the line of the works, and the history of any pixel shows when it began. At Willand, in Devon, effluent pumped into the local stream lifted the land beside it.

That is the difference between a monitoring point and a map. Knowing the cause tells a contractor what to change, an asset owner who is responsible, and a regulator what evidence to hold — a baseline before ground is broken, third-party impact while the works run, and a record afterwards. Railways and roads get the same treatment at route scale: every embankment and cutting re-measured on every pass, so the stretch that starts to slip stands out.

  • Pre-construction baseline for the whole neighbourhood, not just the site boundary
  • Dewatering, tunnelling and excavation effects on neighbouring structures
  • A history per pixel: when it started, when it stopped
  • Evidence for party-wall, consent and dispute cases
What the data showed

Kennington: a pattern of subsidence following the line of the metro works, with the onset visible in the per-pixel history. Willand: uplift beside the stream where effluent was discharged.

APSIS™ · Kennington, LondonAPSIS velocity over Kennington: red subsidence following the line of the metro works, with a displacement time series inset
APSIS™ · Willand, DevonAPSIS velocity over Willand: a blue area of uplift beside the stream, with time-series insets
APSIS™ velocity from Sentinel-1. Kennington: red is sinking along the line of the works; the inset is one pixel's history. Willand: blue is rising beside the stream where effluent was discharged.

05 Energy and storage

Prove the ground over a site is behaving.

Operators, regulators and insurers · Humbly Grove gas storage, Hampshire

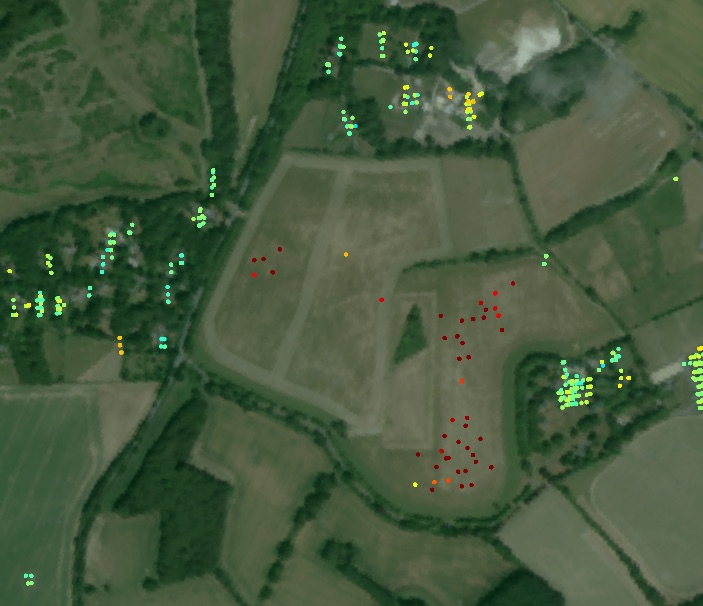
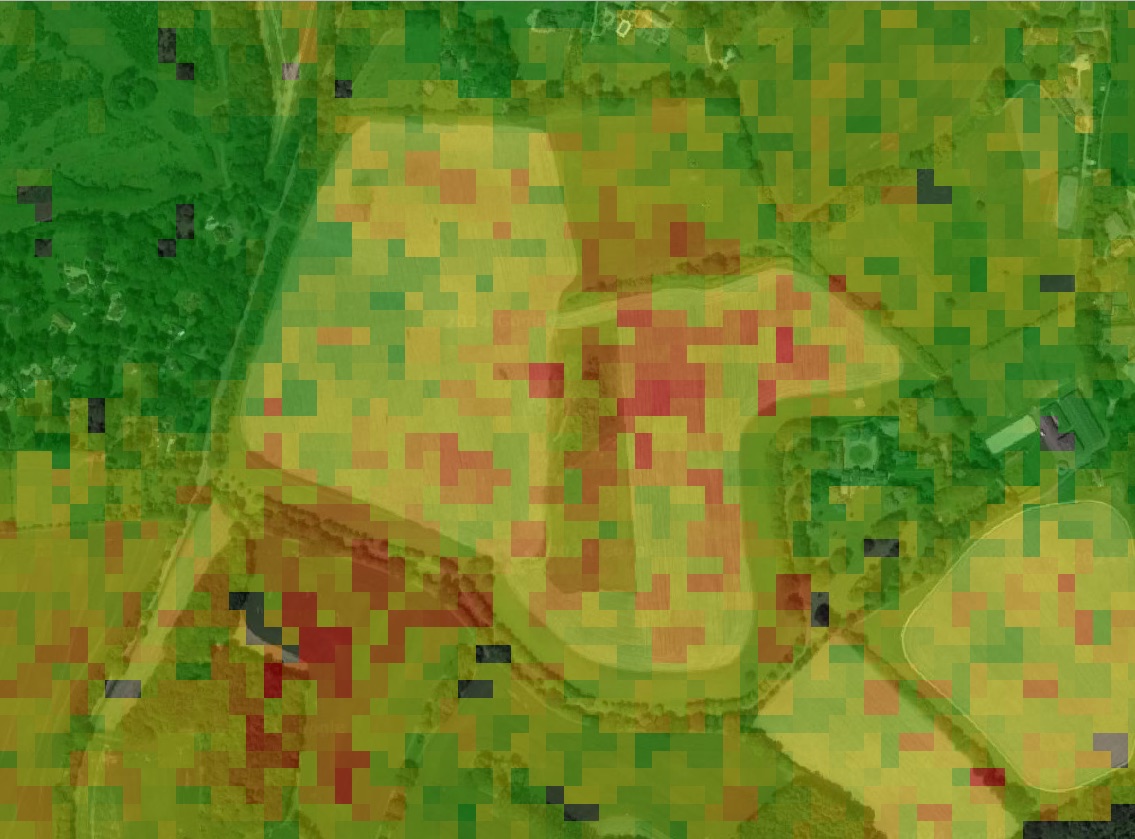
Gas storage, mines, tailings dams, pipelines and geothermal sites all share one question: is the ground over them behaving as the models say? Europe's free EGMS service can only answer it where buildings return a stable radar echo. At Humbly Grove, in Hampshire, EGMS has a handful of points on the farm buildings and nothing over the field that is actually moving.

APSIS™ measures every pixel — the subsiding gas-storage field and the land around it — with a displacement history per pixel back to the start of the Sentinel-1 archive. The same processing has been validated against ground survey at a gas-storage site in the Netherlands at 1.1–1.5 mm a year, including rural ground. It is independent, off-site evidence for operators, regulators, insurers and neighbours, and it needs no equipment on site.

  • Every pixel over the site, not points on the nearest buildings
  • Validated at 1.1–1.5 mm/yr against ground survey, including rural ground
  • No corner reflectors or ground control
  • Any site surveyed within 24 hours of an order, with a ten-year history
What the data showed

EGMS: points only where buildings return a stable echo; the moving field is empty. APSIS™: the whole subsiding field measured, with a history for every pixel.

EGMSEGMS over Humbly Grove: a handful of measurement points on farm buildings, almost none on the field
APSIS™APSIS over Humbly Grove: every pixel measured, the subsiding gas-storage field in red
Humbly Grove, Hampshire, from the same Sentinel-1 archive: EGMS (left) beside APSIS™ (right). Red: motion away from the satellite; yellow: slight motion; green: stable.
Your site

Tell us where.

Any site can be surveyed within 24 hours of an order, with ten years of history delivered alongside. Start with a sample dataset for an area you know.